Florida Climate Data
Two complementary dashboards for researchers, planners, and educators studying climate in Florida. The Climate Station Dashboard presents more than a century of daily observations from 92 cooperative weather stations across the state. The Climate Refugia Layer Explorer is an interactive map of 78 curated climate refugia layers covering historical trends (1950–2023) and future projections under CMIP5 and CMIP6 scenarios.
Both dashboards share the same visual identity, are freely downloadable, and cite the original data sources.
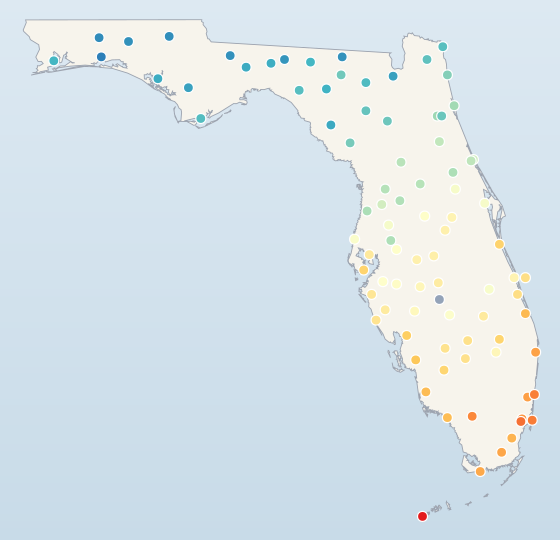
Climate Station Dashboard
Daily observations from 92 cooperative weather stations across Florida (1892–2025), aggregated into annual and monthly climatologies with region and station filters.
- Temperature anomaly and heat wave charts
- Region-by-region station coverage & data quality maps
- Interactive filter by station, region, or year range
- Full spreadsheet download of underlying aggregated data
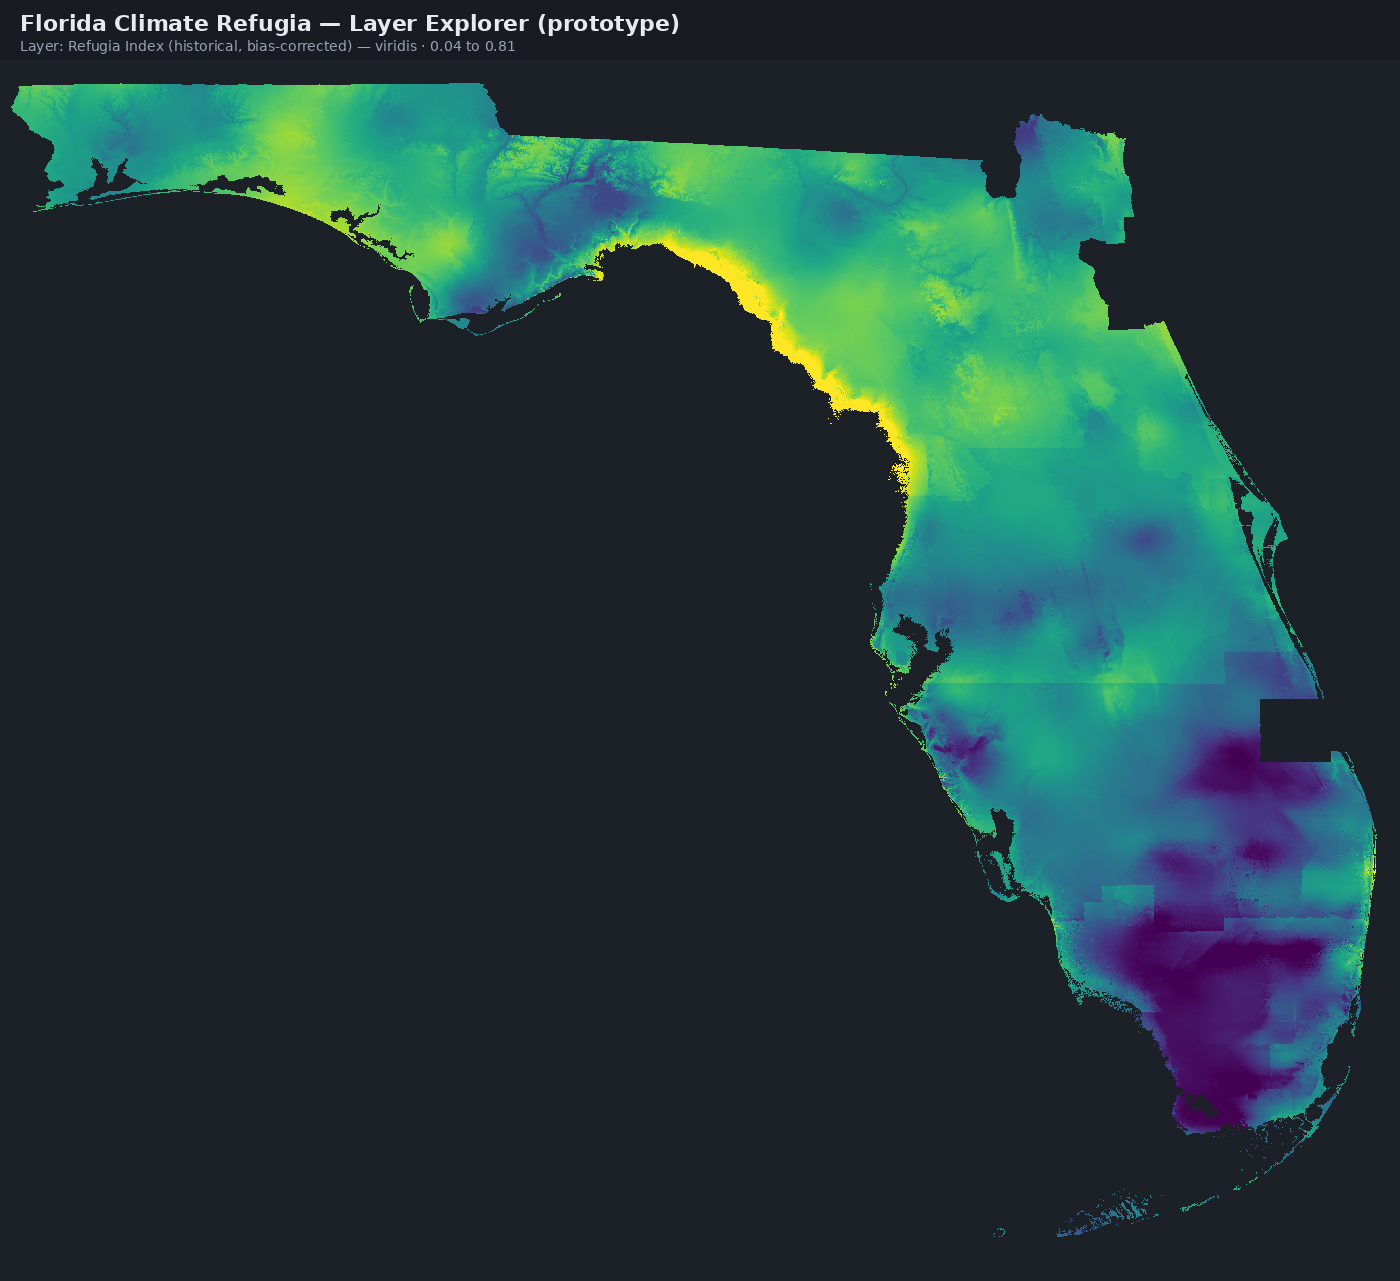
Climate Refugia Layer Explorer
Interactive Leaflet map of 78 curated climate refugia layers — historical change (1950–2023), future projections under CMIP5 and CMIP6, and cross-generation robustness — at 250 m resolution.
- Historical daytime, nighttime, precipitation & solar-PET refugia
- Composite Refugia Index (CRI) and Heatwave Frequency Index
- CMIP5 (RCP 4.5 / 8.5) & CMIP6 (SSP 2-4.5 / 5-8.5) future projections
- Downloadable GeoTIFFs with README and citation
About the project
Florida faces a fast-changing climate: more extreme heat, shifting rainfall regimes, and rising demand for evidence-based conservation and land-use planning. This project brings together two lines of work that most existing tools keep separate.
The Climate Station Dashboard makes it easy to look at more than a century of daily weather observations from 92 stations across Florida — not just headline numbers, but the messy details of station coverage, missing data, and record quality that determine how much you can trust a trend. Data-quality filters are documented in place, and every station's contribution is visible on region-by-region maps.
The Climate Refugia Layer Explorer presents 78 gridded climate-refugia layers at 250 m resolution — historical warming and heatwave indices (1950–2023), a station-calibrated Heatwave Frequency Index, and downscaled future projections from both the CMIP5 and CMIP6 model generations under moderate and high emissions scenarios. Cross-generation robustness layers show where the two model families agree, and a persistence layer identifies refugia projected to remain suitable across the century.
Both dashboards are self-contained, freely downloadable, and cite their original sources. They're intended for researchers, conservation planners, agricultural extension staff, and students who need a starting point for Florida-specific climate analysis without downloading, projecting, and mosaicking gigabytes of climate model output themselves.
Data sources & citation
Station data: Daily weather station observations provided by the Florida Climate Center at FSU (climatecenter.fsu.edu), aggregated into annual and monthly summaries. Stations are grouped into the seven NOAA Climate Divisions for Florida (NCEI nClimDiv scheme) based on county location.
Refugia layers: Derived from PRISM, CHIRPS, and downscaled CMIP5/CMIP6 climate model outputs at 250 m resolution in the Florida GDL Albers projection (EPSG:3086). See the "About / Methods" panel inside the Refugia Explorer for methodology and citation.
Contact: evebohnett@yahoo.com · Eve Bohnett.